Trinidad and Tobago’s TT$63.368 billion budget rests on a difficult proposition: the Treasury expects substantially more revenue while its own economic review forecasts a country producing less in real terms. Finance Minister Davendranath Tancoo’s promise of recovery arrives alongside a projected 2.2 per cent contraction, a deteriorating quarterly labour market and more than TT$1.25 billion of development allocations absent from revised expenditure.1267
The municipal estimates add a separate finding. Reading all 14 corporation totals in the 2027 schedule shows that TT$187.4 million of a TT$219.02 million council capital programme is allocated to UNC-controlled councils: 85.6 per cent. The comparable share was 70.1 per cent in 2026 and 48.6 per cent in the original 2025 allocations. That is a measurable redistribution requiring a published explanation of project selection, local need and delivery capacity.91016
This investigation follows six official publications through three different tests: the economy underlying the budget, the Government’s capacity to execute development expenditure, and the geographic distribution of council capital. Fiscal 2027 refers to October 2026–September 2027; the economic forecast concerns calendar 2026, and the latest labour observations concern January–March 2026. Each figure carries its own period and evidentiary weight.126
The economy beneath the speech
On page 56 of the Review of the Economy, the Ministry projects a 2.2 per cent fall in real activity during 2026. Energy output is expected to decline by 6.6 per cent and non-energy output by 0.7 per cent. The forecast follows the CSO’s estimate of a 0.5 per cent contraction in 2025. First-quarter 2026 output was already 1.8 per cent below the corresponding quarter a year earlier.1
The source distinction matters. The CSO compiles historical GDP estimates; the Ministry prepares the current-year forecast. The review explains that separation explicitly. The projected annual contraction is therefore the Finance Ministry’s assessment of the economy in which its new budget must operate. Two consecutive annual declines would demonstrate sustained weakness if the forecast materialises; a technical-recession diagnosis requires the quarterly sequence.1
Real GDP measures changes in production after adjusting for prices. Higher commodity prices can improve nominal receipts even while physical output falls. For an energy exporter, that distinction reaches directly into taxation and foreign-exchange earnings: favourable prices can support the Treasury without delivering an equivalent expansion in production or employment.16
The weakness extends into domestic indicators. The review records first-quarter declines of 12.9 per cent in the construction-and-hardware retail index, 12.8 per cent in motor vehicles and parts and 11.5 per cent at petrol filling stations. Vehicle sales fell 14.5 per cent year-on-year during the first six months, while local cement sales fell 44 per cent. Construction employment was 2.4 per cent lower year-on-year in Q1.4
These series describe different markets and periods. Their shared significance is pressure on trading, construction demand and investment. A successful recovery programme must reach beyond improved export prices into orders, materials, business activity and work. Expectations of future energy production should be assessed through commissioning dates, actual delivered volumes and the revenues those volumes generate.146
The output forecast turns down
Annual real GDP changes. CSO historical estimate versus Ministry of Finance forecast; energy and non-energy are 2026 forecasts.
CSO historical estimate
Ministry forecast
Ministry forecast
Ministry forecast
Bar lengths show magnitude; the signed values show direction.
Source: Review of the Economy · pp. 17, 56 · Verified 13 October 2026.
Employment: two comparisons, one incomplete account
On page 35 of the speech, Tancoo cites 5,100 more employed people in Q1 2026 than in Q1 2025. That year-on-year comparison is supported by the official record. It sits beside a more recent movement: between Q4 2025 and Q1 2026 employment fell from 569,900 to 564,000, a decline of 5,900, while unemployment rose by 6,200 to 31,900.23
The unemployment rate increased from 4.3 to 5.4 per cent, or 1.1 percentage points. It also stood above the 4.9 per cent recorded a year earlier. Participation remained at 55.1 per cent between the latest two quarters. People outside the labour force include students, retirees and caregivers; that category must be kept distinct from people classified as unemployed.2
The year-on-year gain and quarter-on-quarter decline are compatible because their baselines differ. Quarterly movements can include seasonal effects. The latest movement nevertheless belongs in any account of employment performance, alongside the more favourable comparison selected for the speech. Q1 figures establish conditions in January–March; they cannot establish an October unemployment rate.23
Young people and women bear the sharpest deterioration in the published figures. Unemployment among 15–24-year-olds rose from 7.7 to 12.6 per cent. That age group is identified in footnote 87; the main table’s broader 15–29 group has a different rate, 10.2 per cent. Female unemployment rose from 4.8 to 6.9 per cent, and female employment fell by 6,800, while male employment rose by 900.2
Those differences identify where employment policy must be tested. A national employment promise should be assessed against age, sex, industry and participation, together with wages and hours worked. The speech’s promised ‘explosion of economic activities, hyper-growth, and a boom in job opportunities’ describes an anticipated result. The labour tables establish the starting position.23
The latest quarter weakened
Unemployment rate · all workers. Change: 1.1 percentage points.
CSO observation
CSO observation
Source: Review of the Economy · pp. 107–108, Table 6 and footnote 87 · Verified 13 October 2026.
The revenue rise needed to halve the deficit
The initial fiscal 2026 deficit estimate was TT$3.8647 billion. The revised year-end figure is TT$7 billion, approximately 81.1 per cent larger. The review records revenue of TT$54.2471 billion and expenditure of TT$61.2471 billion. At mid-year, expenditure had been supplemented and price assumptions increased; the closing estimates then revised both spending and revenue down from that mid-year position.5
Fiscal 2027 forecasts revenue of TT$59.729 billion against expenditure of TT$63.368 billion, producing a TT$3.639 billion deficit. Against the revised 2026 figures, receipts must rise by approximately TT$5.482 billion, or 10.1 per cent, while expenditure rises by approximately TT$2.121 billion, or 3.5 per cent. Most of the forecast improvement therefore depends on revenue growth.56
The composition sharpens that question. The speech projects TT$14.355 billion of oil revenue, TT$45.062 billion of non-oil revenue and TT$312 million of capital revenue. These are the speech’s classifications. The delivery test includes collection performance across those categories, production volumes, timing of receipts and the yield from proposed tax changes.6
Oil is assumed at US$77 a barrel and gas at US$5 per MMBtu, compared with US$73.25 and US$4.25 in the preceding original budget. Revenue remains exposed to international prices, domestic output and tax timing. The interactive sensitivity exercise holds expenditure fixed and reduces total forecast revenue; it illustrates the arithmetic of a shortfall, rather than attempting an oil-price forecast.6
The speech expresses the proposed deficit as 2.1 per cent of GDP and invokes a three per cent benchmark. Sustainability also depends on the debt stock, interest burden, recurrent balance and ability to refinance. The review estimates a TT$4.7048 billion current-account deficit for 2026, showing that the imbalance reaches recurrent operations as well as capital spending.56
End-2026 total general government debt is estimated at TT$151.7739 billion. The adjusted measure is TT$149.5462 billion, equal to an estimated 83.3 per cent of GDP; the remainder is sterilised borrowing for open-market operations. The adjusted ratio declines from 83.8 per cent even as the adjusted stock increases. A changing GDP denominator can improve a ratio while the amount owed rises.5
The public needs a contingency path alongside the central forecast: which expenditure is protected, how a receipts shortfall would be financed and what quarterly indicators trigger intervention. Those questions become more important after a year in which the deficit was revised markedly upwards.56
The Treasury’s revenue hurdle
Central government revenue and expenditure, TT$ billions. Revised fiscal 2026 compared with forecast fiscal 2027.
Revised estimate
Revised estimate
Budget forecast
Budget forecast
Source: Budget Statement · pp. 154–155; Review of the Economy p. 19 · Verified 13 October 2026.
Revenue sensitivity
How a shortfall changes the deficit
Illustrative arithmetic. Fiscal 2027 expenditure remains fixed at TT$63.368B. The slider changes total forecast receipts, with no assumed policy response.
- Illustrative revenue
- TT$59.729B
- Illustrative deficit
- TT$3.639B
Source: Budget Statement 2027 · pp. 154–155. Calculation: expenditure minus adjusted total revenue · Verified 13 October 2026.
The TT$1.254 billion execution gap
The PSIP reconciliation provides a direct test of development delivery. Table I records an approved 2026 programme of TT$4.1 billion and revised expenditure of TT$2.846088 billion. Subtraction leaves TT$1.253912 billion, or 30.6 per cent of the allocation, outside revised spending. The document reports overall utilisation of 69.4 per cent.7
The Infrastructure Development Fund utilised 60.6 per cent, compared with 74.0 per cent for the Consolidated Fund. Productive investment and jobs used TT$258.253 million of TT$482.483 million, a calculated 53.5 per cent. That leaves TT$224.23 million between the original allocation and revised expenditure in a priority explicitly tied to production and employment.7
Social investment and safety nets recorded TT$1.145225 billion against TT$1.646501 billion, leaving TT$501.276 million. Infrastructure, transport and digital services performed more strongly, with 88.3 per cent utilisation. The variation directs scrutiny toward the institutions and projects responsible for the slower-performing categories.7
A revised-expenditure figure requires its own reconciliation. Delayed procurement, outstanding invoices, contract administration, project readiness and changes in implementation can affect the timing of recorded spending. For every substantial gap, the useful public record is a project schedule identifying the allocation, commitment, certified work, payment, completion date and reason for delay. Final audited accounts supply a later test.7
The consequences are concrete: capital programmes finance drainage, roads, public facilities, equipment and productive capacity. A spending announcement reaches households through work completed and services improved. The published gap is a starting point for examining that chain, with expenditure and physical delivery tested separately.710
Where development execution fell short
Revised expenditure as a share of the approved allocation, fiscal 2026.
Revised expenditure comparison
Revised expenditure comparison
Revised expenditure comparison
Revised expenditure comparison
Revised expenditure comparison
Source: PSIP 2027 · Table I, printed p. 14 / PDF p. 15 · Verified 13 October 2026.
A smaller capital programme inside a larger budget
The proposed 2027 PSIP is TT$3.9996 billion across 1,272 projects and programmes. It is TT$100.4 million below the original 2026 allocation, a reduction of about 2.4 per cent. Against the original 2025 development estimate of TT$5.666225 billion, it is approximately 29.4 per cent lower in nominal terms.815
The comparison concerns planned allocations. The original 2025 programme was later revised to approximately TT$3.906506 billion; the 2026 programme also has a substantially lower revised outturn. Reading those columns separately shows both the changing ambition of the capital programme and the difficulty in converting appropriations into expenditure.715
Project counts alone give little indication of scale. A programme containing more than a thousand activities needs milestones, cost changes and completion evidence. Fiscal 2027’s larger national expenditure envelope makes the smaller planned capital programme a significant policy choice, particularly alongside the stated objectives of diversification, productivity and job creation.68
The planned development programme
Original/proposed fiscal-year allocations. TT$ billions, nominal values; revised expenditure is a separate measure.
Original allocation
Original allocation
Proposed allocation
Source: PSIP overview, printed pp. 13–18; Development Estimates 2026 summary · Verified 13 October 2026.
Municipal funding: the full 2027 table changes the investigation
The Head 42 council schedule provides a like-for-like geographic comparison. The 2026 document carries the original 2025 and 2026 estimates; the scanned 2027 document supplies the original 2026 and proposed 2027 estimates. All 14 corporation totals were read and cross-checked against their source pages, rather than inferred from selected project announcements.910
The original 2025 allocations ranged from TT$17.15 million to TT$20.05 million. Every council received an allocation. The UNC-controlled group received TT$121.25 million and the PNM-controlled group TT$128.45 million, a relatively close nominal distribution. Adequacy still depends on population, physical infrastructure, service obligations and cash actually released.916
In 2026 the total rose to TT$271.633 million. UNC-controlled councils received TT$190.463 million, up 57.1 per cent; PNM-controlled councils received TT$81.17 million, down 36.8 per cent. Penal/Debe, Princes Town and Chaguanas more than doubled their allocations. San Juan/Laventille was the PNM exception, increasing from TT$17.15 million to TT$19 million.916
Fiscal 2027 intensifies the concentration while reducing the aggregate council programme. The proposed total falls to TT$219.02 million, down 19.4 per cent. UNC-controlled councils together receive TT$187.4 million, a 1.6 per cent reduction from their original 2026 total. PNM-controlled councils receive TT$31.62 million, a 61.0 per cent reduction.1016
San Fernando falls from TT$18.55 million to TT$3.8 million; Diego Martin from TT$11.1 million to TT$2.22 million; Port of Spain from TT$4.1 million to TT$2.6 million. Chaguanas remains at TT$37.9 million, Penal/Debe rises slightly to TT$38.2 million and Princes Town to TT$37.45 million. Siparia rises from TT$21.05 million to TT$26 million.10
There are important differences within the UNC group: Sangre Grande falls from TT$18 million to TT$10 million, while Couva/Tabaquite/Talparo and Mayaro/Rio Claro retain TT$19 million and TT$18.85 million respectively. The evidence establishes concentration across the two groups and substantial variation among individual councils. Both belong in the assessment.1016
The highest 2027 allocation, Penal/Debe’s TT$38.2 million, is 19.1 times Point Fortin’s TT$2 million. The UNC group’s share rises to 85.6 per cent. Those amounts reflect the specific council capital schedule under Head 42; ministry-led infrastructure, utilities, housing and other expenditure require separate mapping before a whole-area spending comparison can be made.10
The map follows the existing 14-corporation geography, using GADM geometry cross-checked against the EBC composite map. Council control follows the 2023 local-government result: Sangre Grande belongs in the UNC group. The proposed 17-area restructuring is a separate prospective exercise. Tobago’s THA and development programme sit outside these 14 Trinidad council totals.1617
The scrutiny should proceed through published criteria. Population, drainage risk, road condition, infrastructure backlogs, project costs and readiness can all justify different sums. The ministry should publish those factors, the submissions it received and the appraisal leading to each allocation, together with cash releases and certified spending. The distribution warrants that explanation; motive requires evidence about the decision-making process.
The geography of public money
Fourteen councils. A changed distribution.
Original and proposed allocations under Head 42, TT$ millions. Fiscal 2025–2027; the colours represent funding, using the existing municipal geography.
UNC-controlled council · 2023 result
Penal/Debe
- Original 2025 allocation
- TT$17.150M
- Original 2026 allocation
- TT$38.160M
- Proposed 2027 allocation
- TT$38.200M
- 2025–26 change
- +122.5%
Council capital allocations measure one programme. Needs, population, cash releases and central-ministry projects must be examined separately.
Trinidad’s 14 municipal corporations. Tobago is administered through the Tobago House of Assembly and has a separate PSIP. Geometry: GADM 4.1, cross-checked against the EBC Municipal Corporation Map (2011); simplified for display. Proposed 17-area boundaries are outside this comparison.
| Corporation | 2025 | 2026 | 2027 |
|---|---|---|---|
| 19.750 | 4.100 | 2.600 | |
| 18.250 | 5.600 | 2.500 | |
| 20.050 | 18.550 | 3.800 | |
| 17.650 | 5.550 | 2.000 | |
| 17.450 | 11.100 | 2.220 | |
| 17.150 | 19.000 | 9.500 | |
| 18.150 | 17.270 | 9.000 | |
| 17.250 | 37.960 | 37.900 | |
| 17.750 | 18.000 | 10.000 | |
| 17.150 | 19.000 | 19.000 | |
| 17.250 | 18.850 | 18.850 | |
| 17.350 | 21.050 | 26.000 | |
| 17.150 | 38.160 | 38.200 | |
| 17.350 | 37.443 | 37.450 |
All-council total: TT$219.020M (2027).
Source: Development Estimates 2026 · Head 42, printed pp. 122–131 · Verified 13 October 2026.
Source: Development Estimates 2027 · Head 42, printed pp. 115–122 / PDF pp. 127–134 · Verified 13 October 2026.
The council capital share shifted again
UNC-controlled councils’ share of the all-council Head 42 capital schedule. Seven UNC and seven PNM councils; original/proposed allocations.
Original estimate
Original estimate
Proposed 2027
Source: 2027 Head 42 pp. 115–122, compared with 2026 Head 42 pp. 122–131 · Verified 13 October 2026.
Disaster preparedness: a second, narrower test
The PSIP lists separate 2027 disaster-preparedness allocations for every council. Princes Town receives TT$1.6 million; Penal/Debe and Siparia TT$1 million each; Chaguanas TT$700,000. Port of Spain, Arima and San Fernando receive TT$100,000 each, and Point Fortin TT$50,000. The proposed activities range from equipment and facilities to emergency-response vehicles.11
Summing the council-specific lines gives TT$5.8 million for UNC-controlled councils and TT$1.25 million for PNM-controlled councils: 82.3 per cent and 17.7 per cent of the TT$7.05 million council subtotal. A separate TT$500,000 Head Office item is excluded. Including it produces TT$7.55 million from the listed lines, whereas the narrative rounds the programme to TT$7.5 million; the calculation preserves the listed amounts.1116
This schedule supports a programme-specific comparison. Its projects have different costs and purposes, so flood exposure, equipment gaps, facility condition and procurement specifications are relevant denominators. A defensible assessment would connect the sums to technical risk assessments and the capacity each council is expected to acquire.11
Disaster-preparedness council allocations
Council-specific lines only, TT$ millions. Head Office’s TT$0.5M is excluded. Programme-specific totals retain the published line-item rounding.
Proposed programme allocation
Proposed programme allocation
Source: PSIP · printed pp. 244–245 / PDF pp. 245–246 · Verified 13 October 2026.
Education, health and agriculture in the expenditure choices
The announced education-and-training allocation falls from TT$8.766 billion in the original 2026 budget to TT$8.033 billion in 2027, down TT$733 million or 8.4 per cent. Health falls TT$153 million to TT$8.061 billion, about 1.9 per cent. Agriculture falls TT$143 million to TT$987 million, approximately 12.7 per cent.612
National security rises TT$955 million to TT$7.321 billion; public utilities rises TT$692 million to TT$4.087 billion; rural development and local government rises TT$516 million to TT$2.323 billion. The last comparison sits beside the reduction in council capital: a ministry’s larger overall allocation and a smaller municipal development schedule can coexist because their scope differs.61012
The next test is programme-level: responsibilities transferred between ministries, recurrent costs, spending through other agencies and the functional classification of expenditure. Education and training are central to productivity; agriculture is central to diversification and food production. The budget should identify what those sectors are expected to deliver with the revised headline allocations.612
The headline sector changes
Original 2026 to proposed 2027 ministry-level allocations, percentage change. Functional spending and responsibility transfers require separate reconciliation.
Published figure
Published figure
Published figure
Published figure
Published figure
Published figure
Bar lengths show magnitude; the signed values show direction.
Source: Budget 2027 pp. 156–157, compared with Budget Statement 2026 fiscal allocations · Verified 13 October 2026.
New revenue measures reach into business cash flow
The proposed limit on carried-forward losses would restrict their use to 75 per cent of chargeable profits in an income year. The speech expects TT$430 million from the measure and proposes a 1 January 2027 start. It aims to secure a contribution from profitable enterprises holding historic losses. Its cash-flow effect on recovering businesses deserves analysis alongside that revenue objective.13
The petroleum unemployment levy is proposed to rise from five to eight per cent of taxable profits from the same date, with TT$155 million additional revenue forecast. The name of the levy should be kept separate from the CSO’s unemployment rate: one is a tax on petroleum-company profits, the other a labour-market statistic.213
Foreign digital and remote services would become subject to standard-rate VAT from March 2027, with TT$18 million projected receipts. Selected supplies would move from zero-rated to exempt status. That change affects associated input-VAT recovery: exempt suppliers can face embedded tax costs, with the incidence depending on their inputs, pricing and market conditions.13
These measures should be assessed through their proposed legal text, commencement dates, exemptions, collection arrangements and behavioural assumptions. The revenue forecast should show how each proposal contributes to the national total and what changes if collections arrive late or yield less. A speech sets the policy intention; the implementing legislation determines the operative rules.613
Relief that can be measured immediately
The TT$250 monthly increases proposed for the Senior Citizens’ Grant, Public Assistance tiers and Disability Assistance are tangible measures. A recipient receiving the full increase for twelve months would gain TT$3,000. The speech identifies 124,000 senior citizens, 13,637 public-assistance recipients and 28,000 disability-assistance recipients.14
That support can improve the household budget directly. It should be assessed through eligibility, start dates, payment delivery and purchasing power. Employment and productivity require a longer chain of results: investment committed, production expanded and sustainable work created. Both forms of policy belong in an assessment of living standards.214
The records that would settle the questions
For the Ministry of Finance, the essential follow-up is the revenue bridge from the revised TT$54.2471 billion baseline to TT$59.729 billion: assumptions by revenue category, collection milestones and a downside financing plan. The development programme needs a project-level explanation of the TT$1.253912 billion gap, including commitments, unpaid certified work, rescheduled activity and completed assets.567
For Rural Development and Local Government, the essential record is the allocation methodology for all 14 councils: applications, technical appraisals, population and infrastructure factors, cash releases and expenditure certified. The 85.6 per cent concentration in 2027 and the disaster-preparedness distribution make disclosure of that method a substantial matter of public accountability.1011
These are questions arising from the documents. This article makes no claim that requests have already been sent or that ministers have declined to respond. A formal response and supporting records can be added through a dated update when obtained.
The budget’s credibility will be established through revenue collected, expenditure reconciled, infrastructure completed and employment measured. Its own publications provide the baseline: a weakening economy, a sizeable development-execution gap and a sharply changed geography of municipal capital. The Government’s recovery promise now has a set of figures against which delivery can be judged.12710
Sources and calculation method
All financial figures are Trinidad and Tobago dollars unless another currency is stated. Party-group totals are calculated from the 14 corporation lines, classified by the EBC’s 2023 result. Percentage changes use the earlier original estimate as the denominator; programme utilisation divides revised expenditure by the approved allocation. Monetary values and percentages are rounded only for presentation. Forecasts, original appropriations, revised estimates and observed labour statistics retain separate labels. The full official documents and page-specific extracts are held in the Document Room.1279101617
The evidence file
Read the Government’s documents
- Budget Statement 2027Primary document · Ministerial statement
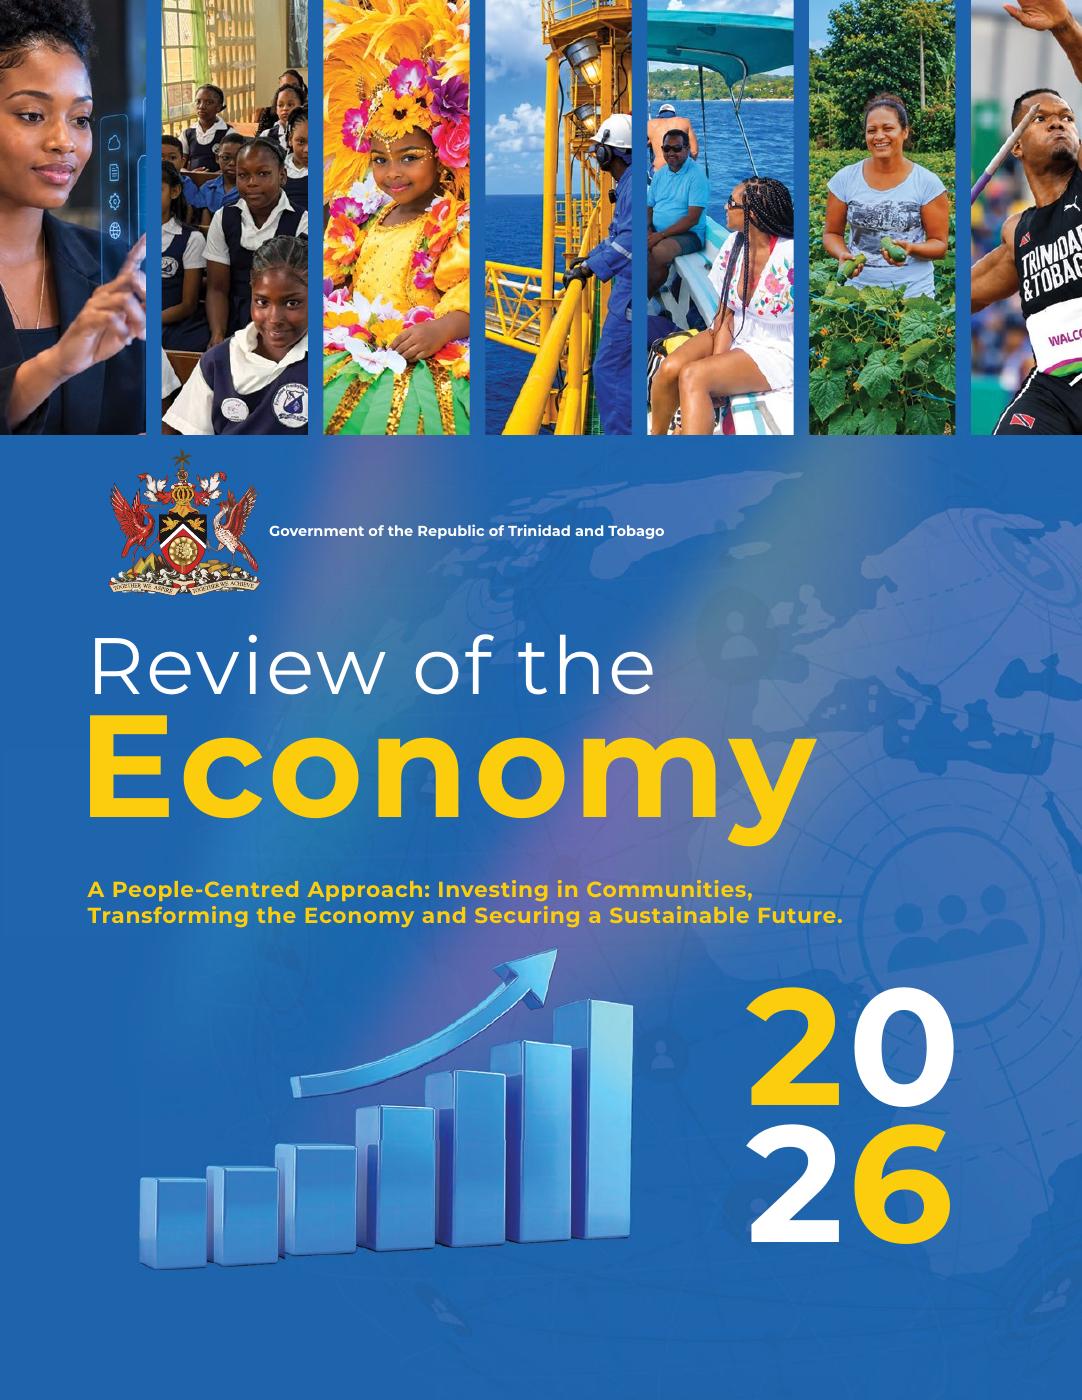
- Review of the Economy 2026Primary document · Economic and fiscal review
- Public Sector Investment Programme 2027Primary document · Development programme
- Development Programme Estimates 2026 — original 2025 and 2026 allocationsPrimary document · Development estimates
- Draft Development Programme Estimates 2027 — municipal capital schedulePrimary document · Scanned development estimates
- Budget Statement 2026 — prior-year fiscal baselinePrimary document · Ministerial statement
Citations & source documents
- [1]Review of the Economy 2026 — pp. 17, 53–56 · PDF pp. 17, 53–56Historical GDP and calendar 2026 forecastCSO estimates real GDP fell 0.5% in 2025. The Ministry projects a 2.2% decline in 2026, energy output down 6.6% and non-energy output down 0.7%. Q1 2026 real activity fell 1.8% year-on-year. The report explains that the Ministry, rather than the CSO, prepares current-year forecasts.
- [2]Review of the Economy 2026 — pp. 19, 106–108 · PDF pp. 19, 106–108Employment, unemployment and participationQ4 2025 to Q1 2026: employed persons 569,900 to 564,000; unemployed persons 25,700 to 31,900; unemployment 4.3% to 5.4%; participation 55.1% in both periods. Table 6, p.107, footnote 87: ages 15–24 unemployment 7.7% to 12.6%. The separately defined 15–29 group has rates 8.5% to 10.2%. Female unemployment rises from 4.8% to 6.9%, with 6,800 fewer employed women; male employment rises by 900. Rounded counts may not sum exactly.
- [3]Budget Statement 2027 — p. 35 · PDF p. 35The year-on-year employment comparisonThe Minister states that 5,100 more persons were employed in Q1 2026 than in Q1 2025, taking employment to 564,000, and compares participation of 55.1% with 54.3% a year earlier. He says the budget will create an ‘explosion of economic activities, hyper-growth, and a boom in job opportunities’.
- [4]Review of the Economy 2026 — p. 56 · PDF p. 56Retail, vehicle and construction indicatorsQ1 2026 retail-sales index declines: construction and hardware 12.9%, motor vehicles and parts 12.8%, petrol filling stations 11.5%. First-half motor vehicle sales fall 14.5% year-on-year and local cement sales 44%; construction employment declines 2.4% year-on-year in Q1. Indicators have distinct coverage and reference periods.
- [5]Review of the Economy 2026 — p. 19; fiscal/debt chapters · PDF p. 19Original forecast, revised balance and debt scopeInitial fiscal 2026 deficit TT$3,864.7M, revised to TT$7,000M; revised revenue TT$54,247.1M and expenditure TT$61,247.1M. Current-account deficit TT$4,704.8M. End-year total general government debt estimate TT$151,773.9M comprises adjusted debt TT$149,546.2M plus TT$2,227.7M sterilised OMO borrowings. Adjusted debt equals an estimated 83.3% of GDP, down from 83.8%, even though the adjusted debt stock increased.
- [6]Budget Statement 2027 — pp. 154–157 · PDF pp. 154–157Fiscal 2027 forecasts and headline allocationsRevised fiscal 2026 revenue TT$54.247B, expenditure TT$61.247B and deficit TT$7B. Fiscal 2027: revenue TT$59.729B, expenditure TT$63.368B and deficit TT$3.639B. Oil assumption US$77/barrel; gas US$5/MMBtu. Revenue comprises oil TT$14.355B, non-oil TT$45.062B and capital TT$0.312B. Headline allocations: education and training TT$8.033B; health TT$8.061B; national security TT$7.321B; public utilities TT$4.087B; rural development and local government TT$2.323B; agriculture TT$0.987B.
- [7]Public Sector Investment Programme 2027 — printed pp. 13–15 · PDF pp. 14–1669.4% programme utilisation2026 approved PSIP TT$4,100.000M; revised expenditure TT$2,846.088M in Table I, leaving TT$1,253.912M. Consolidated Fund utilisation 74.0%; Infrastructure Development Fund 60.6%. Table I: fiscal stability 423.337/230.962; productive investment and jobs 482.483/258.253; public assets 601.838/376.766; infrastructure, transport and digital 945.841/834.882; social investment and safety nets 1,646.501/1,145.225 (allocated/revised expenditure, TT$M).
- [8]Public Sector Investment Programme 2027 — printed pp. 10, 18 · PDF pp. 11, 192027 proposed programmeThe programme proposes TT$3,999.6M across 1,272 projects and programmes. Comparison with the original 2026 allocation of TT$4,100M gives a TT$100.4M reduction. The PSIP spans Central Government, local bodies and the THA; Tobago also has a separately published PSIP document.
- [9]Development Programme Estimates 2026 — original 2025 and 2026 allocations — printed pp. 122–131 · Head 42Original municipal allocationsPort of Spain: 2025 TT$19.750M; 2026 TT$4.100M. Arima: 2025 TT$18.250M; 2026 TT$5.600M. San Fernando: 2025 TT$20.050M; 2026 TT$18.550M. Point Fortin: 2025 TT$17.650M; 2026 TT$5.550M. Diego Martin: 2025 TT$17.450M; 2026 TT$11.100M. San Juan/Laventille: 2025 TT$17.150M; 2026 TT$19.000M. Tunapuna/Piarco: 2025 TT$18.150M; 2026 TT$17.270M. Chaguanas: 2025 TT$17.250M; 2026 TT$37.960M. Sangre Grande: 2025 TT$17.750M; 2026 TT$18.000M. Couva/Tabaquite/Talparo: 2025 TT$17.150M; 2026 TT$19.000M. Mayaro/Rio Claro: 2025 TT$17.250M; 2026 TT$18.850M. Siparia: 2025 TT$17.350M; 2026 TT$21.050M. Penal/Debe: 2025 TT$17.150M; 2026 TT$38.160M. Princes Town: 2025 TT$17.350M; 2026 TT$37.443M. Totals: TT$249.700M in 2025 and TT$271.633M in 2026. Political classification follows the EBC’s 2023 local-election result, not parliamentary constituencies.
- [10]Draft Development Programme Estimates 2027 — municipal capital schedule — printed pp. 115–122 · PDF pp. 127–134All 14 municipal capital estimates, 2027Port of Spain: TT$2.600M. Arima: TT$2.500M. San Fernando: TT$3.800M. Point Fortin: TT$2.000M. Diego Martin: TT$2.220M. San Juan/Laventille: TT$9.500M. Tunapuna/Piarco: TT$9.000M. Chaguanas: TT$37.900M. Sangre Grande: TT$10.000M. Couva/Tabaquite/Talparo: TT$19.000M. Mayaro/Rio Claro: TT$18.850M. Siparia: TT$26.000M. Penal/Debe: TT$38.200M. Princes Town: TT$37.450M. Total TT$219.020M; PNM-controlled councils TT$31.620M; UNC-controlled councils TT$187.400M. These match the Local Government Services aggregate on printed p.115. Allocations are estimates rather than certified disbursements or completed works.
- [11]Public Sector Investment Programme 2027 — printed pp. 244–245 · PDF pp. 245–246Council-specific disaster preparednessTT$M: Port of Spain 0.1; Arima 0.1; San Fernando 0.1; Point Fortin 0.05; Chaguanas 0.7; Diego Martin 0.1; San Juan/Laventille 0.5; Tunapuna/Piarco 0.3; Sangre Grande 0.5; Couva/Tabaquite/Talparo 0.5; Mayaro/Rio Claro 0.5; Siparia 1; Penal/Debe 1; Princes Town 1.6. Separate Head Office allocation 0.5. Listed council amounts total 7.05, with 5.8 assigned to UNC-controlled councils and 1.25 to PNM-controlled councils. All listed lines including Head Office sum to 7.55, versus a rounded narrative total of 7.5.
- [12]Budget Statement 2026 — prior-year fiscal baseline — printed p. 27 · PDF p. 29Original 2026 headline allocationsTT$B: education and training 8.766; health 8.214; national security 6.366; public utilities 3.395; rural development and local government 1.807; agriculture 1.130. These announced ministry allocations are a different measure from functional spending or an individual project’s expenditure.
- [13]Budget Statement 2027 — pp. 158–166, 176–177 · PDF pp. 158–166, 176–177Proposed revenue measuresCarried-forward business losses limited to 75% of chargeable profits, projected TT$430M additional revenue; petroleum unemployment levy from 5% to 8%, projected TT$155M; both proposed for 1 January 2027. Foreign digital/remote services proposed for standard-rate VAT from March 2027, projected TT$18M. Selected supplies would move from zero-rated to exempt; the distinction changes recovery of associated input VAT.
- [14]Budget Statement 2027 — p. 36 · PDF p. 36TT$250 grant increasesProposed monthly increases of TT$250 in the Senior Citizens’ Grant, every Public Assistance tier and Disability Assistance for adults and eligible children. The speech identifies 124,000 senior citizens, 13,637 public-assistance recipients and 28,000 disability-assistance recipients. Twelve months of a TT$250 increase equals TT$3,000.
- [15]Development Programme Estimates 2026 — original 2025 and 2026 allocations — Development programme summaryOriginal 2025 development allocationThe total original fiscal 2025 development estimate is TT$5,666,225,000; revised 2025 estimate TT$3,906,505,896; original fiscal 2026 estimate TT$4,100,000,000. Original estimates are compared with original estimates when describing the change in planned capital expenditure.
- [16]EBC — 2023 local-government election resultsA seven-seven political mapSeven councils each for PNM and UNC; Sangre Grande is UNC-controlled.
- [17]EBC municipal map and cartographic methodCurrent geography first; proposed transfers as reportedCurrent 14-corporation geometry; GADM 4.1 cross-checked against the EBC map.
Every document cited above is held on this site, with the key clauses, extracts and findings set out in full and a link to the document of record.
Cite this article
Outlets, researchers and broadcasters may quote this reporting with credit and a link to the original.
Robinson, P. (13 October 2026). "Behind Budget 2027: a contracting economy and the geography of public money". PearceRobinson.com. https://pearcerobinson.com/reporting/budget-2027-economy-jobs-municipal-funding
Sources
Independent reporting by Pearce Robinson. Corrections and responses may be submitted here.